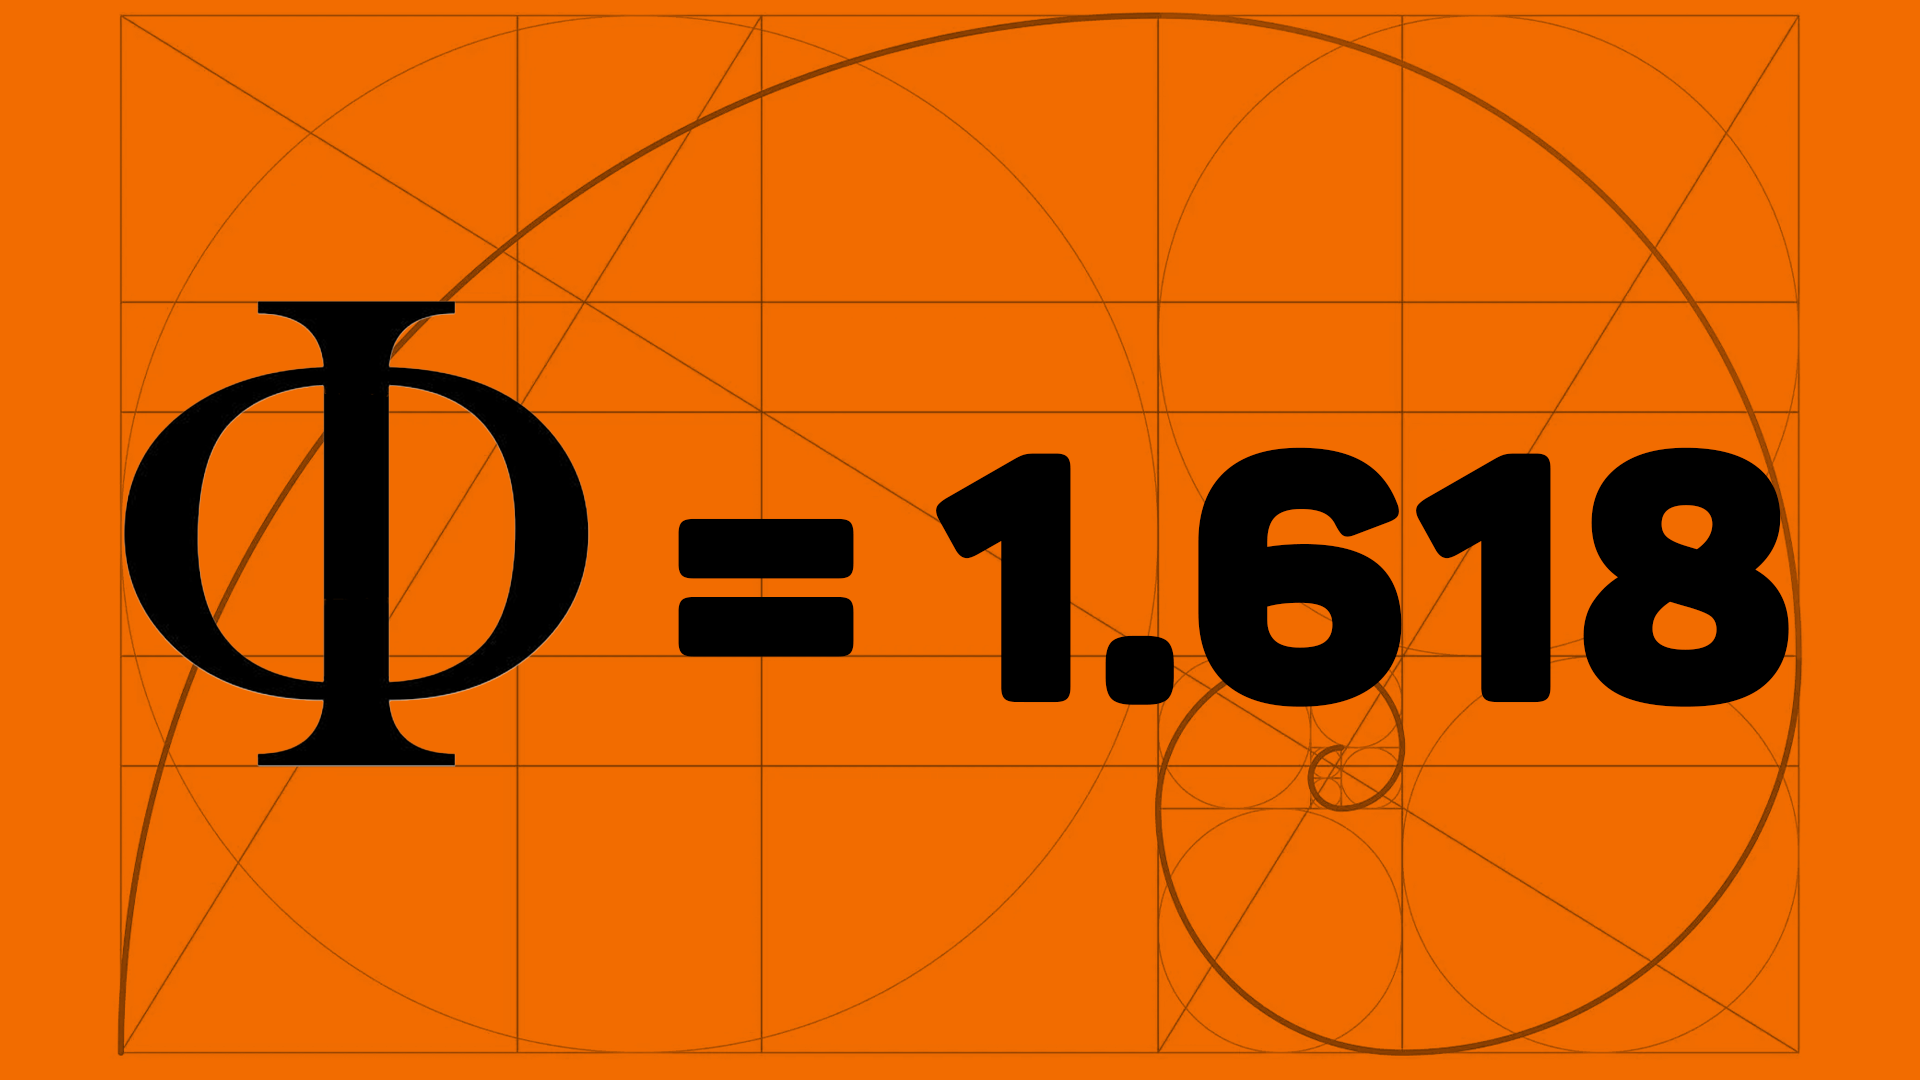
The Golden Ratio, approximately 1.618, is a fascinating number that appears throughout nature, art, architecture, and even financial markets. For traders and analysts, the Golden Ratio is more than a mathematical curiosity; it is a tool that can offer insights into price movements and trends. Here, we’ll explore how this ratio works in financial market analysis, particularly within Fibonacci-based techniques, and discuss advanced equations that make this ratio an essential part of technical analysis.
What is the Golden Ratio?
The Golden Ratio is derived from the Fibonacci sequence, where each number is the sum of the two preceding ones (e.g., 0, 1, 1, 2, 3, 5, 8, 13, etc.). Dividing any Fibonacci number by its preceding number converges to approximately 1.618, the Golden Ratio. In financial markets, the ratio 1.618—or its inverse, 0.618—is often used to predict potential reversal and breakout points.
The Golden Ratio in Fibonacci Levels
Fibonacci levels in trading are based on ratios derived from the Golden Ratio and are used to identify possible areas of support, resistance, and price reversal. Key Fibonacci levels include 0.236, 0.382, 0.5, 0.618, and 0.786, with 0.618 and 1.618 as primary indicators. When prices approach these levels, they often experience support or resistance, allowing traders to anticipate potential market moves.
Advanced Fibonacci Equations and the Golden Ratio
- Fibonacci Retracement Levels with Golden Ratio Extensions
- Basic Retracement: Traders often calculate Fibonacci retracement levels by applying 0.618 and 1.618 ratios to a recent high-to-low or low-to-high move. This gives possible reversal levels that markets might respect during a pullback.
- Advanced Retracement Calculations: Using extensions like 1.272 and 2.618 (derived from 1.618), traders can identify deeper retracement zones beyond traditional levels, helpful in strong trends.
- Fibonacci Arcs and the Golden Ratio
- Fibonacci Arcs are drawn based on the 1.618 ratio, creating arcs from a high to a low or vice versa. These arcs represent dynamic support and resistance, helping traders see potential reversal zones across different price levels.
- For algorithmic trading, Fibonacci Arcs allow for predictive analytics by marking curved resistance and support points that adapt as price moves.
- The Golden Ratio in Fibonacci Fans
- Fibonacci Fans consist of diagonal lines based on Fibonacci ratios from a key high or low point. These lines, especially those based on 0.618 and 1.618, offer support and resistance that dynamically shift as price moves.
- Fibonacci Fans allow traders to track trend strength, with price respecting these lines during strong directional trends, providing opportunities to align entries or exits with the trend.
- Golden Ratio in Time Zones
- Fibonacci Time Zones use the Golden Ratio to map out when reversals or trend shifts may happen, applying Fibonacci intervals to time rather than price. Calculated from significant highs or lows, these intervals predict timing for pullbacks or extensions based on 1, 2, 3, 5, 8, and 13 periods, for instance.
- In volatile markets, Fibonacci Time Zones allow traders to forecast when price movements may slow or reverse, offering a time-based advantage to their trading strategy.
- Golden Ratio Clusters for Enhanced Support and Resistance
- Fibonacci Cluster: When multiple Fibonacci levels (especially those including 0.618 and 1.618) overlap, they form a Fibonacci cluster, indicating a high-probability area of support or resistance. These clusters combine retracement and extension levels across multiple time frames or price waves.
- Clusters help traders make confident decisions in volatile markets by pinpointing where prices are most likely to react.
The Psychological Impact of the Golden Ratio
Beyond technical calculations, the Golden Ratio has a psychological aspect in trading. Known to reflect patterns in nature and aesthetics, it also resonates with traders as a guide to natural order. Whether consciously or unconsciously, many market participants react to key Fibonacci levels, often triggering self-fulfilling price movements.
Practical Tips for Applying the Golden Ratio
- Combine Golden Ratio with Oscillators: To confirm price movement near Fibonacci levels, use RSI or MACD indicators to avoid entering prematurely or against momentum.
- Utilize Multiple Time Frames: Analyze the Golden Ratio on multiple time frames to better understand long-term trends and shorter-term retracements, aligning trades accordingly.
- Consider Market Conditions: In highly volatile markets, Fibonacci levels may need to be adjusted or combined with other tools, such as Volume Profile, to capture additional market behavior.
Mastering the Golden Ratio in Financial Markets
The Golden Ratio (1.618) is a profound tool for technical analysis, blending mathematical precision with natural order. For traders and algorithm writers, understanding and applying the Golden Ratio in advanced Fibonacci equations adds depth and accuracy to market predictions. By mastering this ancient ratio, traders can enhance their strategies, timing, and overall success in navigating the complexities of the financial markets.

