In financial markets, the Fibonacci sequence isn’t just a mathematical curiosity—it’s a powerful tool that has inspired algorithms for predictive analysis, price targeting, and automated trading strategies. Algorithm writers rely on Fibonacci ratios and sequences to code sophisticated models that detect potential support, resistance, and trend reversals. This article dives into advanced Fibonacci techniques and equations that enhance algorithmic analysis in financial markets, providing deeper insights for developers.
Fibonacci in Financial Algorithms: An Overview
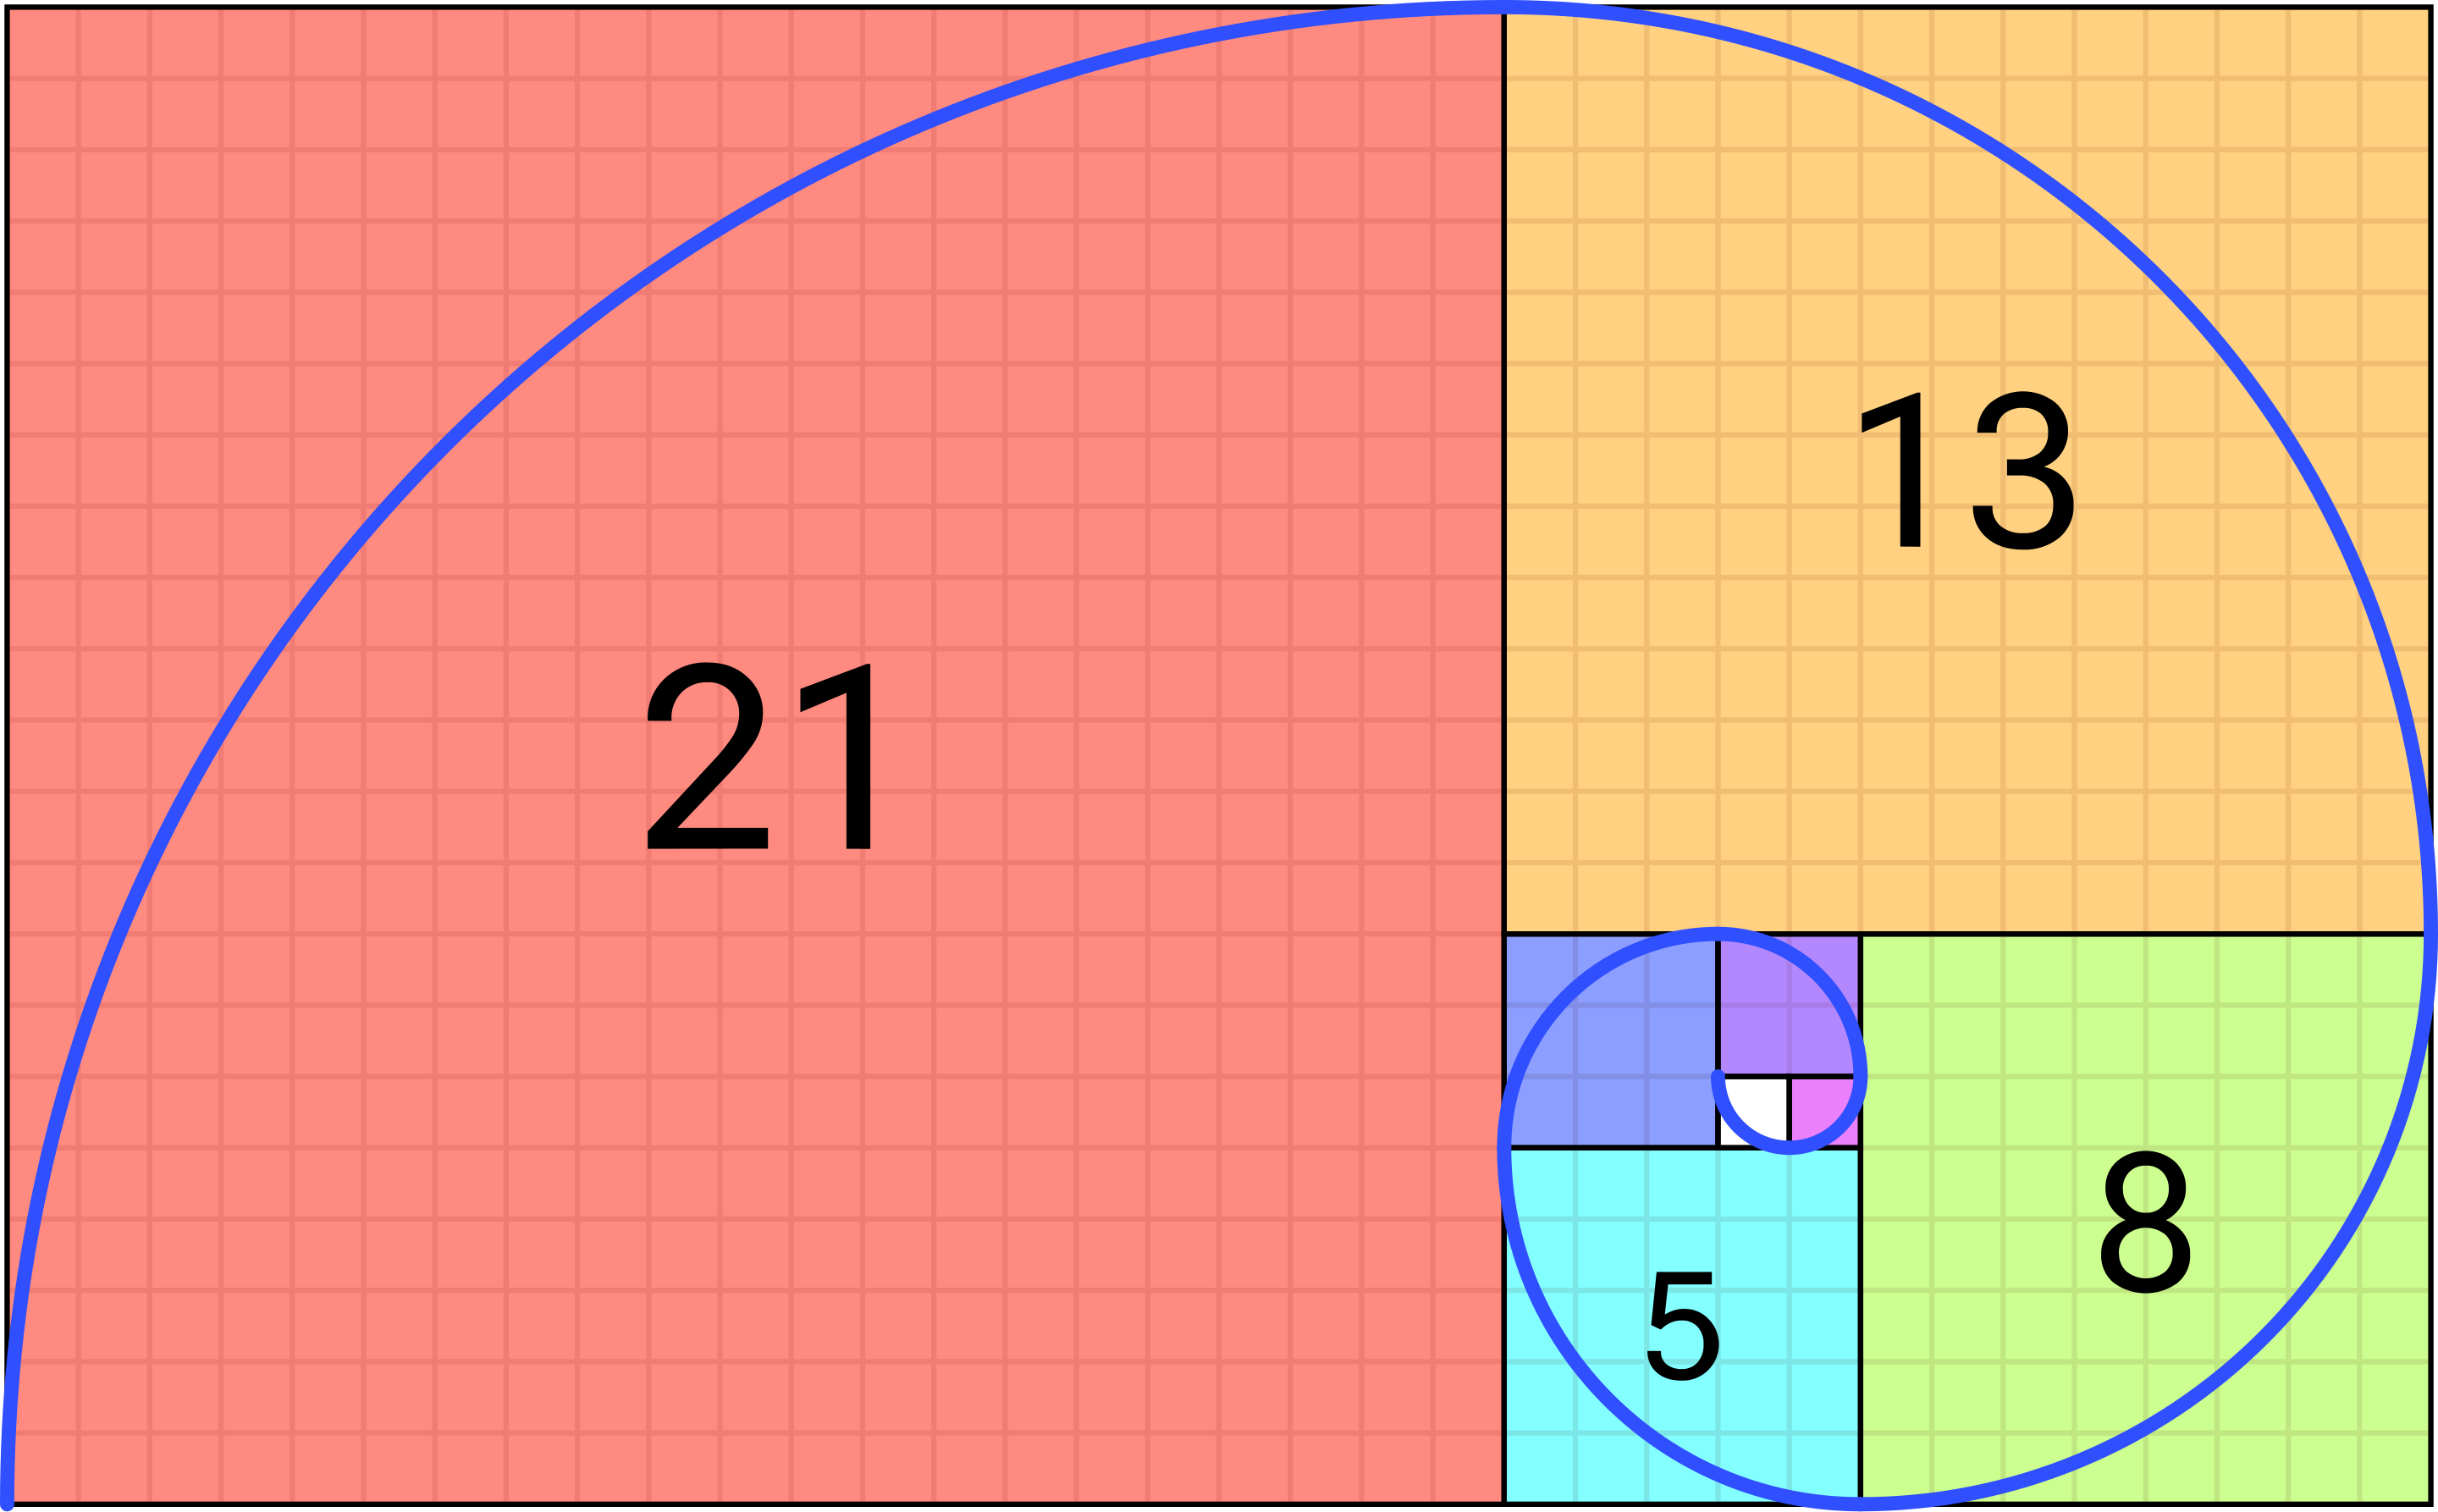
The Fibonacci sequence produces ratios that reflect naturally occurring patterns across many domains, including financial markets. Key ratios (0.236, 0.382, 0.5, 0.618, and 0.786) serve as guides for algorithm writers in coding levels where markets may experience key turning points.
For algorithms, these Fibonacci levels become “triggers” or “thresholds” that can set off buy or sell orders based on historical price movements. Algorithm developers can program systems to automatically track, analyze, and act upon Fibonacci-based levels, turning these ratios into highly functional trading tools.
Advanced Fibonacci Equations for Algorithm Development
Beyond the standard Fibonacci retracement and extension levels, advanced techniques and equations can make algorithms even more responsive and adaptive to market movements:
- Fibonacci Time Zones for Predictive Algorithms
- Fibonacci Time Zones apply the Fibonacci sequence to the timeline of a price chart. Algorithms can use these time intervals to predict when trend reversals or consolidations might occur by calculating Fibonacci-based intervals (1, 2, 3, 5, 8, etc.).
- For algorithmic trading, Fibonacci Time Zones help developers create time-based triggers, ensuring trades align with calculated market cycles.
- Fibonacci Arcs for Dynamic Support and Resistance Levels
- Fibonacci Arcs draw curved lines based on Fibonacci ratios from a defined high to low or vice versa. These arcs represent dynamic levels of support and resistance, offering additional context for algorithmic decision-making.
- Algorithms programmed with Fibonacci Arcs can adapt dynamically, adjusting positions based on these curved, responsive levels, making them useful in both ranging and trending markets.
- Fibonacci Fans for Trend Confirmation
- Fibonacci Fans consist of diagonal lines calculated from a key high or low point using Fibonacci ratios. Fans are useful in confirming trend strength, as price often respects these lines.
- By integrating Fibonacci Fans, algorithms can detect when prices approach these fan lines, helping to validate a trend and automatically adjust trading actions accordingly.
- Fibonacci Clusters for High-Confidence Zones
- A Fibonacci cluster is the overlap of Fibonacci levels from multiple price waves. Algorithm writers overlay different Fibonacci levels from various price movements to identify clusters of support or resistance, which serve as high-probability trading zones.
- Clusters allow algorithms to add a layer of confirmation, entering or exiting positions when multiple Fibonacci levels align, enhancing precision in volatile market conditions.
- Fibonacci Convergence and Divergence Analysis
- Fibonacci Convergence: When multiple Fibonacci levels from different time frames align at a similar price level, they create high-probability zones. Algorithms can be programmed to identify convergence, providing strong buy or sell signals.
- Fibonacci Divergence: Divergence occurs when Fibonacci levels move apart, suggesting weaker support or resistance. Algorithm writers can set divergence detection to adjust trade intensity or seek confirmation from other indicators.
Tips for Coding Fibonacci into Trading Algorithms
For effective use of Fibonacci in trading algorithms, here are some best practices:
- Combine Fibonacci with Momentum Indicators: Algorithms that combine Fibonacci levels with momentum indicators like RSI or MACD can improve accuracy, especially when confirming reversals or continuations.
- Use Multiple Time Frames: Including Fibonacci analysis across multiple time frames can increase accuracy, allowing algorithms to detect long-term trends and align them with short-term opportunities.
- Incorporate Dynamic Stop-Loss Adjustments: Fibonacci-based levels are often used as stop-loss or profit-taking zones. By programming algorithms to adjust stops based on Fibonacci, traders can optimize risk management.
Example Algorithm Calculation Using Fibonacci Clusters
Below is a sample Fibonacci Cluster calculation algorithm:
- Fibonacci Retracement: Start with a high-to-low range and apply standard Fibonacci retracement ratios (0.382, 0.5, and 0.618).
- Fibonacci Extension: For further analysis, apply extension levels from another wave, perhaps 1.618 and 2.618.
- Cluster Identification: Overlay the retracement and extension levels to locate clustering, where multiple Fibonacci levels align, creating a zone for higher-probability trades.
These calculations add advanced layers of Fibonacci to an algorithm’s design, enhancing the ability to anticipate market movements in precise zones.
Elevating Algorithmic Precision with Fibonacci
For algorithm writers in financial markets, Fibonacci tools offer a powerful way to integrate predictive and reactive elements into code. From Time Zones and Arcs to Clusters, these advanced Fibonacci techniques bring flexibility, depth, and accuracy to trading models, optimizing entry and exit strategies with mathematical clarity. By mastering Fibonacci in algorithmic coding, developers can build smarter, more adaptable algorithms that capitalize on market rhythms.